Monthly Archives: January 2018

Missing out on SSAS Data Source Views
We usually don’t give much importance to the Data Source Views (DSV). But if we work on it properly, it makes your life very easy.
Refer to few of the following notes on DSV, which might help in making it more useful for your project.
- Its only DSV where you can pull multiple data sources tables. This is the only place where you bring multiple data sources table in 1 DSV and later use in cube. how else ?? 😛
- While creating manual DSV (New Diagram), you can pull one table only and then add related tables one by one (option is Right Click–> Show related tables). So you for example you can literally pull a fact table and call related tables for related dimensions. Also for those dimension call related tables for snow flake tables and in the end get one good quality Diagram without much hassle.
- You also get to see original name of column even if you change to Friendly Name for it (doesn’t work for table though). Following is the screenshot of how column name appears after renaming it. Table is also renamed from original DimGeography but only new name appear.

- you might want to see only original name, to avoid any confusion with table or column or may be just want to know what came from source. Right Click –> un-check option Show Friendly Names.
- You cannot delete a column just by Click–>Delete on DSV. Change the table to Named Query and remove the column from list of SELECT is your option.
- DSV always warn you for incorrect relationships. For example, where it should be Many to one or one to many, Matching data type warning etc. Always listed to these warning. This is your practice ground for dimension usage relationships.
- Did you use Zoom –> To Fit option ? If not then try it thank me later.

- You can also manipulate values in Explore Data. Like select random or top sorted sample. Even increase/decrease the number of sample rows, by default its 5000. To achieve this, Explore Data for a table and in window with sample click on Setting option and manipulate as your choice (Don’t forget to click on refresh button to sample, all highlighted in following screenshot).

- If you are new to SSAS DSV or tutoring, use Name Matching Criteria for quick relationships from tables pulled from data source. Click anywhere on DSV and look at properties with NameMatchingCriteria.
I could talk about some more interesting DSV related things, but length of the post is a concern. Let me know if you need details on these or anything more under comments section.

Tips and Tricks on SSRS
SSRS provide a lots of properties to update the report according to any vague requirement given by Clients. Multiple properties and all changeable is the best feature of SSRS and gives it edge over all new reporting tools.
Over the time developers can learn many ways of manipulating reports. Few cool tricks are listed in this post and can help in exploring more ways of making desired changes in SSRS reports.
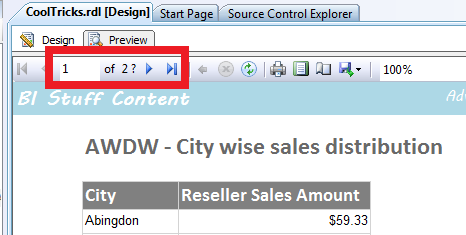
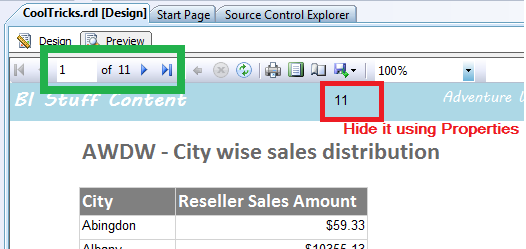
1. How to get Total page number in ribbon above report?
SSRS doesn’t calculate total page number and shows on top ribbon like 1 of 2 ? for page numebrs. Instead of “?” it should be final number of page like 11. “2” represents next page as SSRS do not calculate total number of pages.
We will need to ask SSRS to calculate Total Page Number explicitly. To do so;
Pick the “Built in Field” Total Pages (shown as =Globals!TotalPages) and drag it on header or anywhere in report (hide it if not needed by visibility property).
As shown below:

Reports rendering will be like:
| Before | After |
 |
 |
2. Get the data refresh time of Cube (last processing time)
I have seen most of the legendary system uses extra SSAS cube to store value of last processing time of main SSAS Cube.
Use following query to get refresh time of any cube and keep it as a new dataset in report.
SELECT TOP 1 LAST_DATA_UPDATE FROM $system.mdschema_cubes |
Save as dataset “dsLastUpdatetime”. And in report create a Text Box and keep expression as:
="Data Refresh Time: " & First(Fields!LAST_DATA_UPDATE.Value, "dsLastUpdatetime") & " UTC" |
3. Based on rendering/export format, change properties.
SSRS provides multiple rendering format or Export format. With a property Globals!RenderFormat.Name we can make sure how final output in desired format (excel/pdf/csv etc.) should appear.
For example in my report I show Selected parameter values on top on SSRS view. But if user download the file he/she wants only report data. So I change visibility of text Box (of parameter values) as following:
=IIF(Globals!RenderFormat.Name = "EXCEL", FALSE, TRUE) |
And SSRS and Excel have different appearance as final report.
4. If you are not using Tooltip, you are not using SSRS properly
Option for Tooltip is everywhere. If you are not using it you are missing out a big feature. Users of SSRS mostly expect interactive reports though SSRS but its not as fun as other tools. At least tool tips add a one more attribute of reporting objects (like bar values in charts, description of column header etc.). Use it under Chart properties, Series properties, Text Box properties etc. to add more details in report.
5. Use SWITCH function for expressions instead of nested IIF.
Its easy and fast. Don’t forget to use TRUE as a default value. Example given below:
=SWITCH(Fields!RegionShort.Value = "N", "North", |
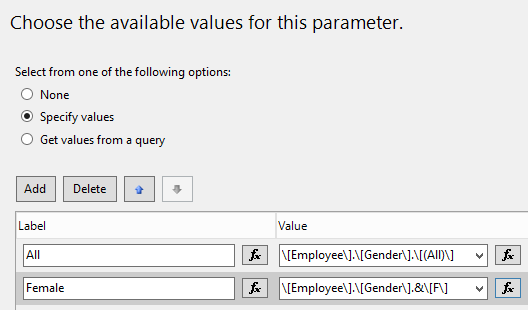
6. Do not need datasets for Parameters all the time (even in MDX reports)
Mostly we rely on datasets values for Available values in property of Parameters. Its not mandatory. Imagine All and Female are two values of Parameter. In MDX dataset lot of stuff will be needed to avoid Male values.
Someone will create a dataset with except for Male option for same case. Or provide a filter on parameter to avoid Male option (with All member including). Simply, provide static values, just like below:
7. Create simple dynamic members on Parameters instead of dataset.
On extension to above, we can create dynamic members as per requirement just using same method.
For example, an Adventure Works report is needed where Parameter Product Category should have 3 values ALL, Actual_Products(comprising Bikes and Components) and By_Products(comprising Accessories and Clothing). Not values from cube.
So either you can use following MDX as dataset to fill the values:
WITH |
Or simply just get the parameter Available values as following:
| ALL | =”[Product].[Category].[(All)]” |
| Actual Products | =”{[Product].[Category].[Bikes],[Product].[Category].[Components]}” |
| By Products | =”{[Product].[Category].[Accessories],[Product].[Category].[Clothing]}” |
